**NEW Publication** Icing severity indices are a measure for the in-flight icing risk and are an important factor for path and mission planning. Small aircraft, such as unmanned aerial vehicles (UAV) and urban air mobility (UAM) vehicles, are particularly sensitive to icing and thus proper assessment of weather risks is critical.
Icing severity is a metric for how quickly in-flight icing degrades the performance of the aircraft in a certain area. Performance means the ability of the aircraft to generate lift and sufficient thrust to stay airborne. In icing conditions, lift generation of the wings decreases while drag increases and thrust of the propeller decreases. This ice accumulation is very dangerous and is likely to lead the UAV to crash. For these UAVs, knowing the icing severity in an area becomes crucial, as they are much more sensitive to icing compared to their larger manned counterparts. Hence, having an accurate index is vital for planning purposes as to minimize hazardous conditions and to enable increased mission success rates.

Our recently published article proposes a new method to calculate an icing index that is better suited for unmanned aircraft. Icing indices today – as defined by the Aviation Weather Center (AWC) – categorize icing severity levels according to how fast 6 mm of ice accumulates on an airfoil. The issue is that this fixed value of ice thickness will have different degrees of impact, depending on the size of the aircraft. The amount of ice build-up that is deemed severe is relative to the size of the aircraft. One can think of it in terms of ice relative to the airfoil size, and the larger the fraction the worse it is. A small aircraft will experience severe icing effects with 6 mm, while a larger aircraft it might experience just light icing effects. The AWC icing index also does not account for the type of ice encountered which has been shown to degrade performance differently. Hence, the AWC definition is lacking in scalability and does not differentiate between different meteorological icing conditions. Our new proposed method compensates these shortcomings.
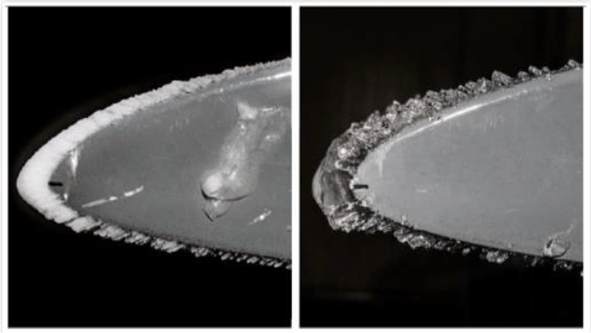
There are two main types of ice that are of interest, rime ice which preserves the airfoil shape, and glaze ice which leads to more uneven surfaces leading to worse performance in general. One more aspect of ice types is that it affects different aircraft surfaces differently. Rime ice is less severe on the wings while glaze is worse. On the propeller, it is the opposite. The main reason is that the propeller can shed ice due to rotational forces. Glaze ice has little effect on the propellers as it can shed this ice type completely. Rime ice has a higher adhesion force which allows it to hold on more. It can also lead to uneven shedding as rime ice has less cohesion with itself which leads to increased degradation.
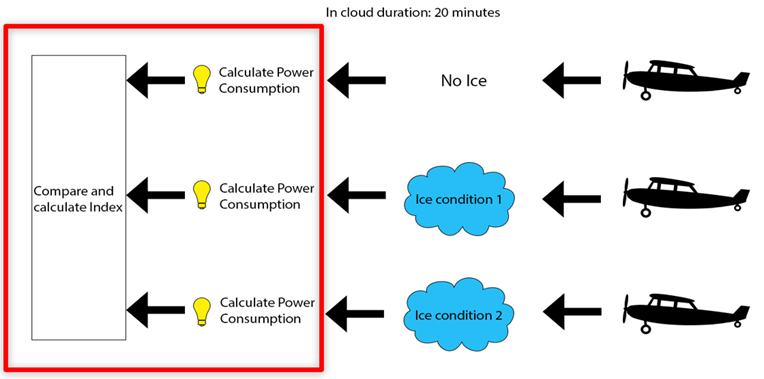
Our proposed method assumes exposing an aircraft to different ice for 20 minutes, then uses lift and drag curves to calculate the performance degradation directly. The increase in power consumption is compared to the baseline no ice condition to calculate the index. By calculating the index this way, scalability is not an issue as the performance curves are directly linked to the aircraft and key variables, such as wingspan, are included in the calculation. The different icing conditions that are tested also consider specific icing conditions. It does mean, however, that the proposed method is aircraft specific and will require more testing in general to get the iced performance curves.
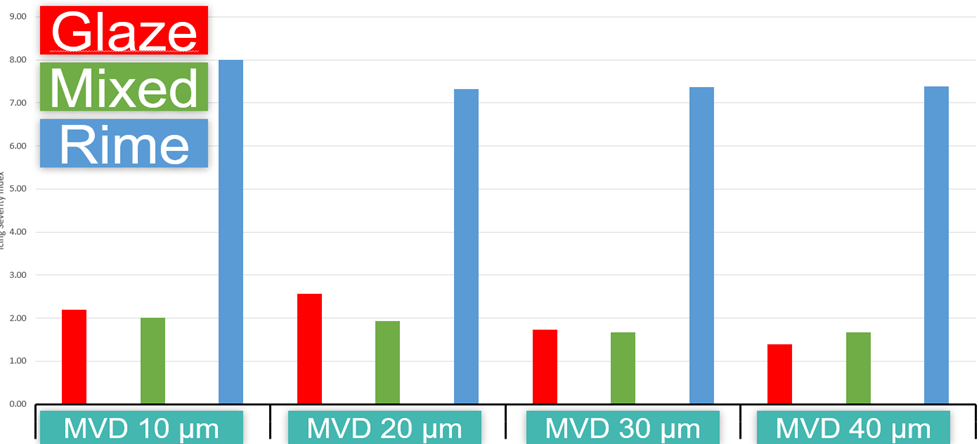
Some of the results are shown below with icing severity index values at different median volume diameters (MVDs) of droplets and it shows that rime ice is overall worst. This is because the propeller is what is keeping the aircraft in the air as it is the propeller that generates thrust and hence dominates the index. A decrease in propeller efficiency means it compensates by an increased consumption in power to deliver the same thrust. With longer icing durations, this might change because the wing does not shed ice naturally as the propeller does. Hence, with longer durations, the glaze will ultimately overtake rime as the worst ice type.
To summarize, icing indices today have been found to be inadequate for planning purposes for typical UAVs and UAMs. UAVs and UAMs tend to be much smaller than the commercial airliners and icing indices today do not take size into account. Our proposed method uses icing performance degradation metrics directly to calculate an icing index. This new method accounts for the problems with scaling and also accounts for different icing conditions. It is, however, more complex to calculate as it is aircraft specific.
To improve upon what is investigated in the paper, including 3D effects, and expanding the investigated icing conditions would be beneficial for a more accurate index.
Written by Michael Cheung.
Reference: Cheung, M., Hann, R., Johansen, T.A. (2022). UAV Icing: A Unified Icing Severity Index Derived from Performance Degradation. AIAA Atmospheric and Space Environments Conference. DOI: 10.2514/6.2022-3906
